Imaging of acoustic decay and tunnelling. (a) Schematic of the raster scan imaging process where the lensed fibre is scanned in the y-direction for several x-positions. The different scans for all the x-positions are assembled in post processing. (b) Imaging of acoustic decay in a device with a 150 um long tunnel barrier. The deviceContinue reading “acoustic_tunneling”
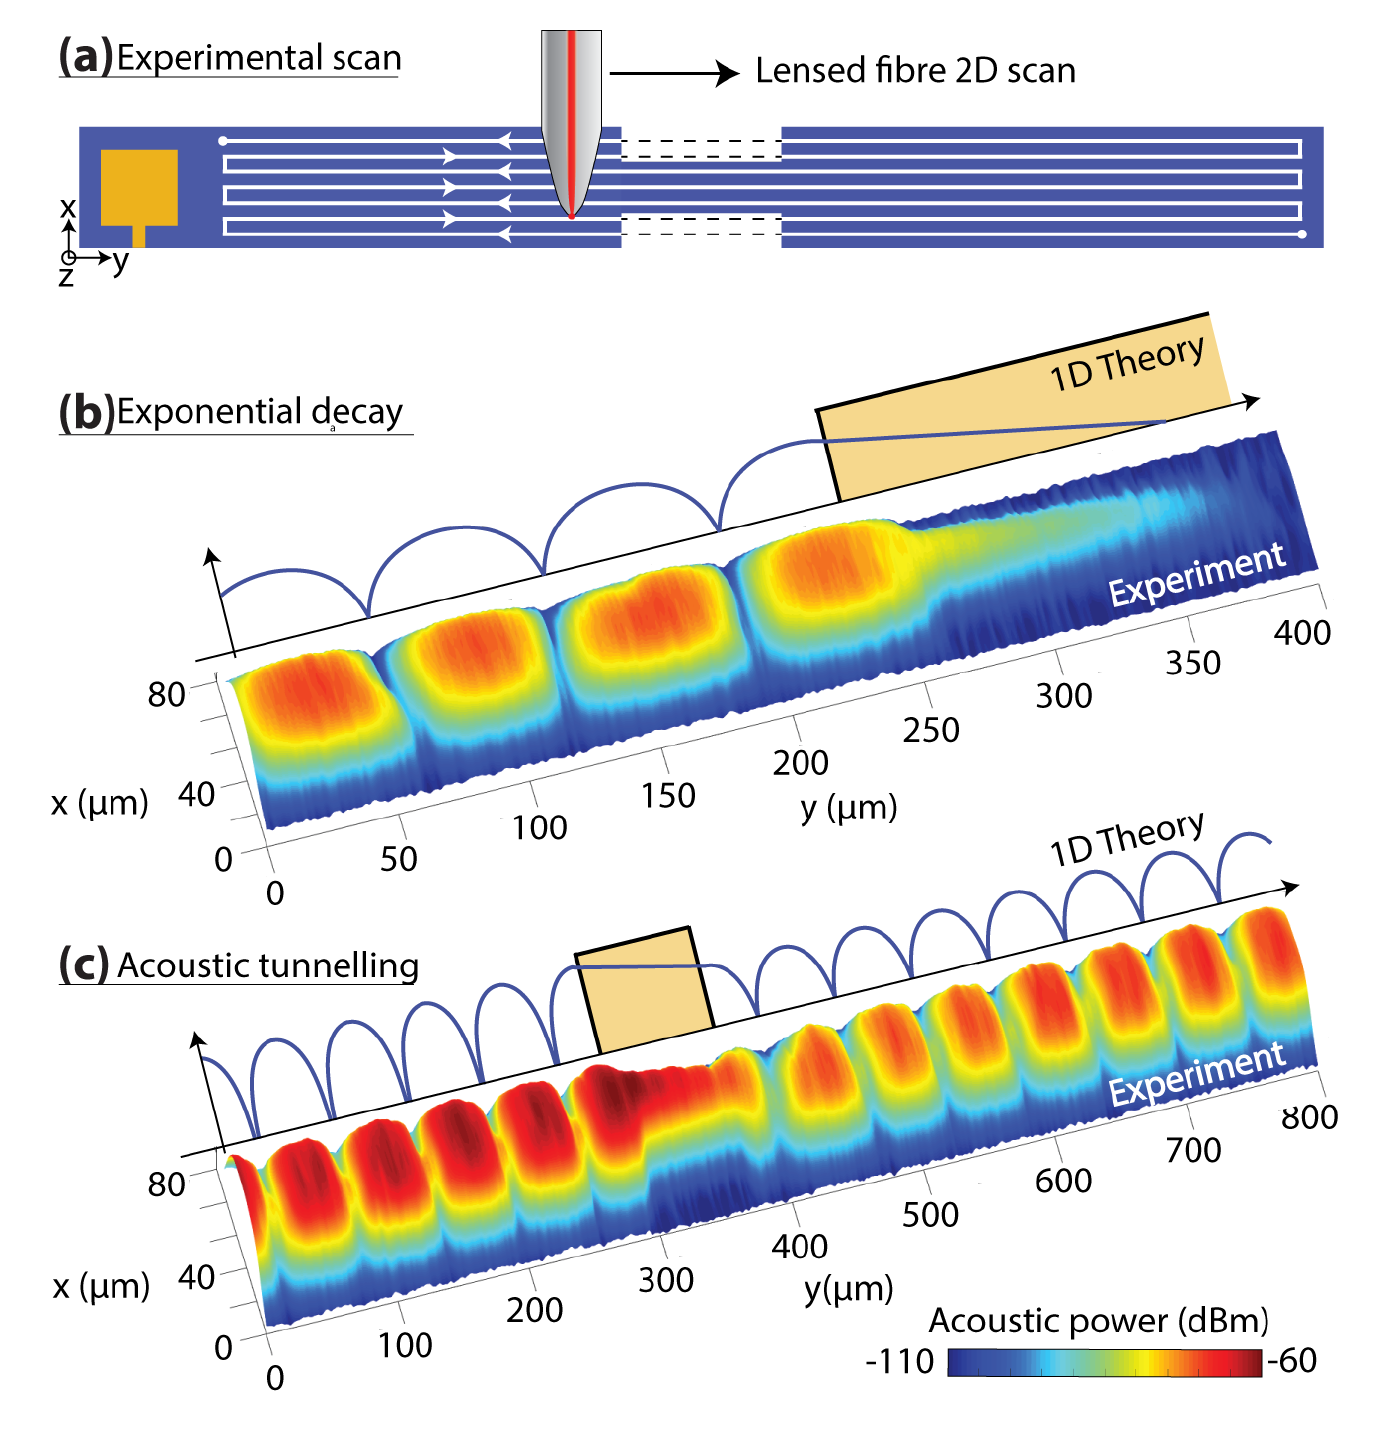
Imaging of acoustic decay and tunnelling. (a) Schematic of the raster scan imaging process where the lensed fibre is
scanned in the y-direction for several x-positions. The different scans for all the x-positions are assembled in post processing.
(b) Imaging of acoustic decay in a device with a 150 um long tunnel barrier. The device was continuously driven at 4.9 MHz
while imaging. Top schematics show a theoretical prediction of acoustic exponential decay in one dimension. (c) Imaging of
acoustic tunnelling. The device was driven at 5.5 MHz and has a 75 um long tunnel barrier. The experimental data in (b) and
(c) was smoothed with a Gaussian filter.
